Learn Power BI – Insightful Overview
(1 day – 9AM to 4PM)
Hands-On Workshop
- Participants interact with the instructor, in a virtual classroom, to complete hands-on activities.
Learning Outcomes
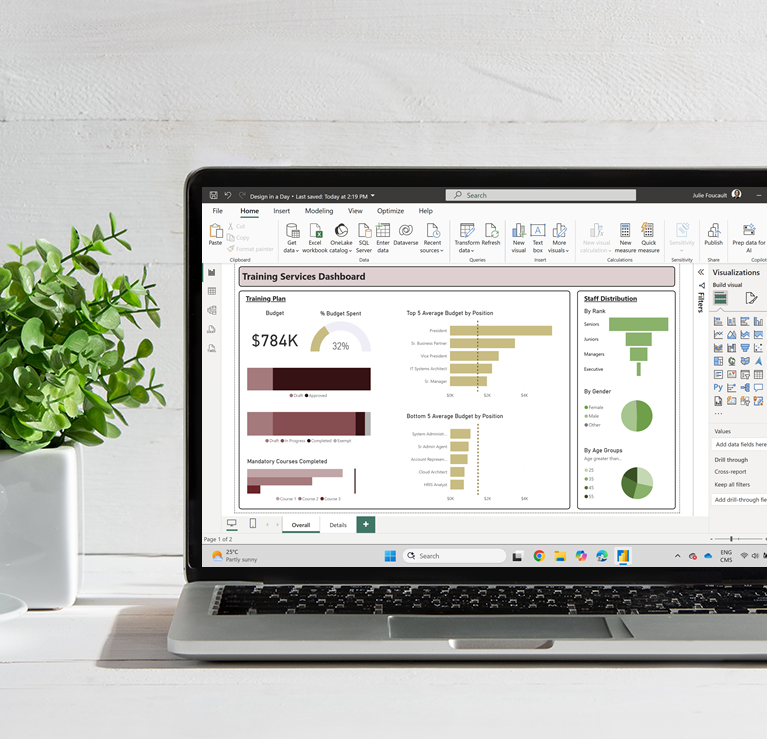
- Design insightful Power BI data visualizations
- Enable engaging end-user data interactions in your Power BI report
- Learn how to update and share Power BI reports and dashboards
Technical Requirements
- Power BI Desktop
- Teams
Alternative
Favor the Introduction to Power BI (2 Days) course to gain a savvy understanding of the Power BI workflow: create, share, update. (Read more.)
Which Power BI training session best matches your needs? (Take our Quiz)
$575.00
Target Audience
Managers, Administrative Assistant, Report Builders
Methodology
Applied demonstrations of the Power BI workflow; self-paced exercises with businesslike examples; troubleshooting; problem solving; course notes in English and French; web documentation references.
Technical Requirements
Participant must have access to 2 screens: using a laptop and a monitor is adequate.
Participant must install free apps on his/her computer: Teams and Power BI Desktop.
Microsoft Certified Instructor
Our Ottawa-based instructor is certified by Microsoft, as a skilled professional in Business Intelligence Reporting. Read more.
Quality Service
Workshops are limited to a maximum of 10 attendees to address each participant’s questions and requests.
Interact with the live instructor to explore solutions and to resolve issues.
Training Schedule
Training takes place from 9AM to 4PM (Eastern Time).
Learning Outcomes
- Design insightful Power BI data visualizations
- Enable engaging end-user data interactions in your Power BI report
- Learn how to update and share Power BI reports and dashboards
Topics
1. Build a report with Power BI Desktop
- Explore the Desktop application
- Import data from an Excel spreadsheet with Power Query: Set Data types and remove blank rows
- Set Data columns preferred format, summarization, categorization and sort by order
- Create visualizations: matrix, bar chart, funnel chart, gauge, slicer, etc.
- Customize visualizations: format axis, title, color theme, add a constant, filter on Top 10, etc.
- Insert visual elements: image, text box
- Add bins or sub-grouping options to your data
- Explore end-user interaction features: slicers, filters, drill-through, etc.
- Control interactions between visualizations
- Calculate indicators with quick measures: Sum, Count, Average, Ratio, etc.
2. Share on Power BI Service, the cloud environment
- Browse the interface
- Publish to a workspace
- Share within the organization
- Embed Power BI content in Power Point