Learn Power BI – Insightful Overview
(1 day – 9AM to 4PM)
Hands-On Workshop
- Participants must bring their own laptop.
Learning Outcomes
- Design insightful Power BI data visualizations
- Enable engaging end-user data interactions in your Power BI report
- Learn how to update and share Power BI reports and dashboards
Training Location
Alternative
Favor the Introduction to Power BI (2 Days) course to gain a savvy understanding of the Power BI workflow: create, share, update. (Read more.)
Which Power BI training session best matches your needs? (Take our Quiz)
$575.00
Target Audience
Managers, Administrative Assistant, Report Builders
Methodology
Applied demonstrations of the Power BI workflow; self-paced exercises with businesslike examples; troubleshooting; problem solving; course notes in English and French; web documentation references.
Bring Your Own Device
Each participant must bring their laptop with the Power BI Desktop application installed.
Microsoft Certified Instructor
Our Ottawa-based instructor is certified by Microsoft, as a skilled professional in Business Intelligence Reporting. Read more.
Quality Service
Workshops are limited to a maximum of 10 attendees to address each participant’s questions and requests.
The training is delivered in a modern environment: offering a comfortable and bright workplace, centrally located downtown Ottawa.
Training Schedule
Training takes place from 9AM to 4PM (Eastern Time).
Learning Outcomes
- Design insightful Power BI data visualizations
- Enable engaging end-user data interactions in your Power BI report
- Learn how to update and share Power BI reports and dashboards
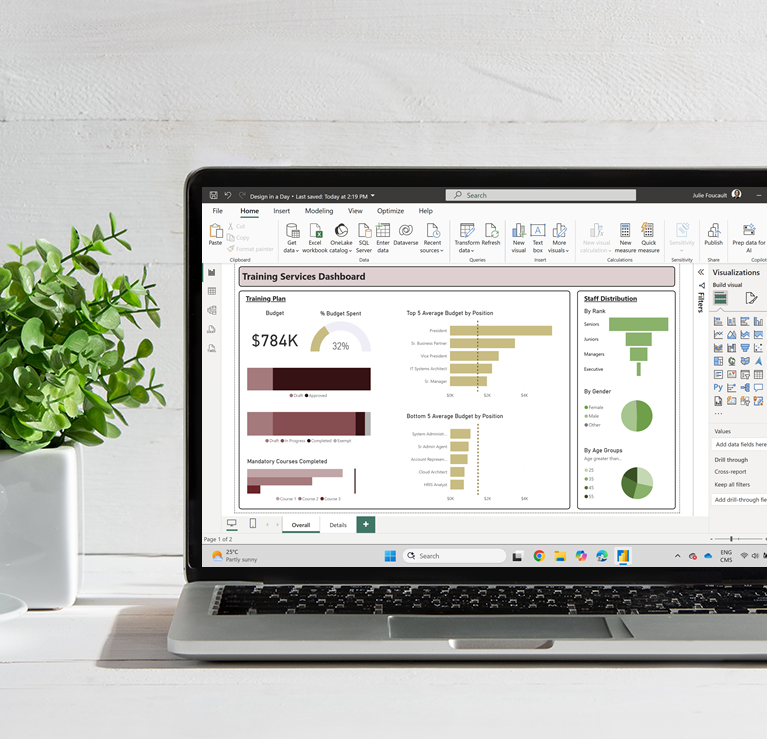
Topics
1. Build a report with Power BI Desktop
- Explore the Desktop application
- Import data from an Excel spreadsheet with Power Query: Set Data types and remove blank rows
- Set Data columns preferred format, summarization, categorization and sort by order
- Create visualizations: matrix, bar chart, funnel chart, gauge, slicer, etc.
- Customize visualizations: format axis, title, color theme, add a constant, filter on Top 10, etc.
- Insert visual elements: image, text box
- Add bins or sub-grouping options to your data
- Explore end-user interaction features: slicers, filters, drill-through, etc.
- Control interactions between visualizations
- Calculate indicators with quick measures: Sum, Count, Average, Ratio, etc.
2. Share on Power BI Service, the cloud environment
- Browse the interface
- Publish to a workspace
- Share within the organization
- Embed Power BI content in Power Point